


Page 30 - journal_2017_december_uploaded_2023_mar_20
P. 30
Sri Lanka Navy Journal  30
                                                ANALYSIS


        16.    The four main types of submarines are the Diesel-Electric Attack Submarines
        (SSs and SSKs), Nuclear Powered Attack Submarines (SSNs), Guided-Missile Submarines
        (SSGNs), and Ballistic Missile Submarines (SSBNs). They are differentiated by their primary
        armaments and propulsion systems (Eaglen and Rodeback, 2010). Apart from these the
        Diesel-Electric Cruise Missile Submarine (SSG) and Diesel-Electric Powered Small Coastal
        Submarine (SSC) are also taken into conventional submarine categories. When analysed it
        is seen that submarine capabilities are present in 38 countries. 28 countries possessed only
        SSKs. North Korea scored top rank in conventional powered submarines with 23 SSKs and
        32 SSCs. Japan had 22 SSKs, Turkey had 14 SSKs, Germany had 13 SSKs, Greece and South
        Korea had 12 SSKs. Apart from that the US, UK and France had only SSNs.


        17.    Six countries can be highlight as per their capabilities in descending order Russia
        with 22 SSKs, 22 SSNs, 9 SSGNs and 18 SSBNs. U.S. with 59 SSNs, 4 SSGNs and 14 SSBNs.
        China with 26 SSKs, 6 SSNs, 29 SSGs and 5 SSBNs.  UK comprised with 13 SSNs and 4
        SSBNs. Finally India the only country with nuclear powered submarine in the IOR with 22
        SSKs and 2 SSBNs.

        18.    When the submarine capabilities if Indian Ocean States are analysed ten countries
        have SSKs and only India has SSBNs, when summarizing the descending order of submarine
        power in IOR, India 22 SSKs and 2 SSBNs, Iran has 10 SSKs, Australia and Singapore have
        6 SSKs, Pakistan and Israel have 5 SSKs, Egypt has 4 SSKs, South Africa has 3 SSKs and
        Malaysia and Indonesia have 2 SSKs. Further Bangladesh, Myanmar and Thailand are in
        highly possible state of adding submarine forces for their fleets.


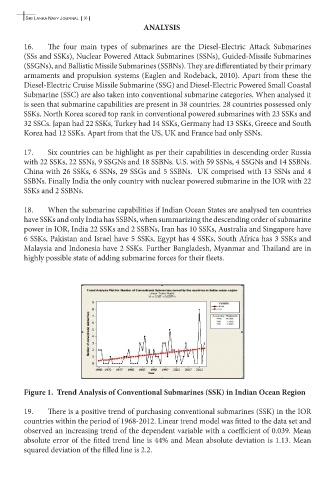
        Figure 1.  Trend Analysis of Conventional Submarines (SSK) in Indian Ocean Region


        19.    There is a positive trend of purchasing conventional submarines (SSK) in the IOR
        countries within the period of 1968-2012. Linear trend model was fitted to the data set and
        observed an increasing trend of the dependent variable with a coefficient of 0.039. Mean
        absolute error of the fitted trend line is 44% and Mean absolute deviation is 1.13. Mean
        squared deviation of the filled line is 2.2.

